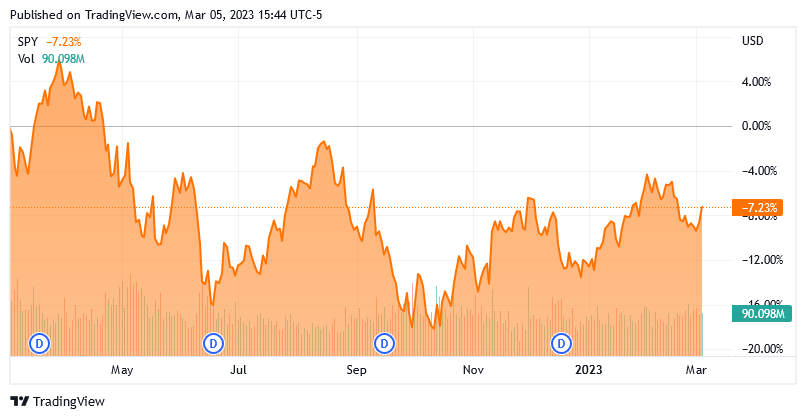
There has been a lot of talk in various media sources lately that describe the U.S. market as cheap. This is likely due to the fact that the market has fallen fairly significantly from its bubble levels over the past year. Over the past twelve months, the S&P 500 (NYSE: SPY) has fallen 7.23%:

The index fell about 20% during 2022, which is likely the thing that has caused many people to believe that the index is attractively valued today. However, this simplistic belief ignores the fact that the index was very richly valued prior to the carnage last year. The decline has made it somewhat less overvalued, but it has hardly made it cheap. We can use a variety of metrics to see this quite clearly.
Total Market Cap-to-GDP Ratio
One metric that we can use to very easily see that the market is far from cheap is the total market cap-to-GDP ratio. This is a ratio that we do not hear about very often, but famed investor Warren Buffet once stated that it is “probably the best single measure of where valuations stand at any given moment.” This ratio is calculated exactly the way that might be expected. In short, we take the total market value of all domestic corporations and we compare that to the gross domestic product of the nation. The theory here is that the stock market of a healthy economy should not be more richly valued than the entire production of that country. The Business Professor explains this succinctly,
The stock market capitalization-to-GDP ratio is a ratio that measures the overall value of all publicly traded stock in a market in comparison to the country’s gross domestic product (GDP). This ratio is otherwise called the Buffett Indicator, it is the stock market cap to the GDP of a country. Essentially, the market cap-to-GDP ratio helps to determine whether a market is overvalued or undervalued, compared to the historical average.
Historically, this ratio tends to revert to its historical mean over the long term. For the United States, that historical mean is 100%. Thus, anything over that 100% level is a clear sign that the market is overvalued. As of the market close on March 3, 2023, the total market capitalization of the American stock market stood at $40.4509 trillion. That is 154.7% of the last reported gross domestic product, which clearly indicates that the market is significantly overvalued despite the decline that we saw over the past twelve months. In fact, the market looks much more expensive than it did at any time prior to 2020:

Thus, the market remains not only overvalued but has some room to fall before hitting the historical mean of 100%. This alone could be concerning, but there are other signs that the market may be overvalued.
CAPE Ratio
We can also look at the cyclically-adjusted price-to-earnings ratio to see this overvaluation. This ratio, which is also known as the Shiller P/E ratio is calculated by taking the current price of a given asset and dividing it by its average ten years of earnings. This is done in order to smooth out the fluctuations that occur because of the business cycle. As of the market close on March 2, 2023, the CAPE ratio stood at 29.38, which is still a very high level historically:

While this is down a bit from the nosebleed levels of 2021 due to the market turbulence last year, it is still above the 90th percentile. This clearly indicates that the market is too expensive relative to its historical levels. As with the total market cap-to-GDP ratio, the CAPE ratio tends to revert to its mean over time, which is 17.00 over the past century. Thus, either every company in the market needs to immediately double its profit or the market needs to decline significantly to bring this ratio in line with its historical average. Normally, though, the market will overshoot the average on the way down so we could have a way to fall. It is, admittedly, uncertain when this will happen but it clearly presents risks to anyone buying stocks today.
Rule Of Twenty
Another thing that shows that the market may be overvalued today is the “Rule of 20.” This is another historical rule that investors do not usually know about or think about. Even fewer in the media are aware of it, or at least they are keeping quiet about it. In short, this rule is a shortcut that allows investors to price two significant risks into stocks. The first risk is inflation since that is ostensibly linked to interest rates as we saw last year. The second risk is earnings, which should rise when inflation is high, as they did among the major oil companies recently. However, we have not seen the same earnings strength out of companies in several other sectors. That could be concerning since energy may be the only reasonably affordable sector in the economy today. I discussed this in a recent blog post. This is very different than what we saw in the late 1970s when earnings generally rose significantly due to the high inflation that prevailed at this time.
The rule of twenty basically states that inflation plus a stock’s price-to-earnings ratio should sum to twenty. That is not the case right now:

According to the Rule of 20, the S&P 500 is about 25% overvalued right now. That is not as bad as other ratios such as the total market cap-to-GDP ratio stated, but clearly, it also points to a distinct overvaluation in the market. Thus, caution is warranted for anyone investing in the market today.
