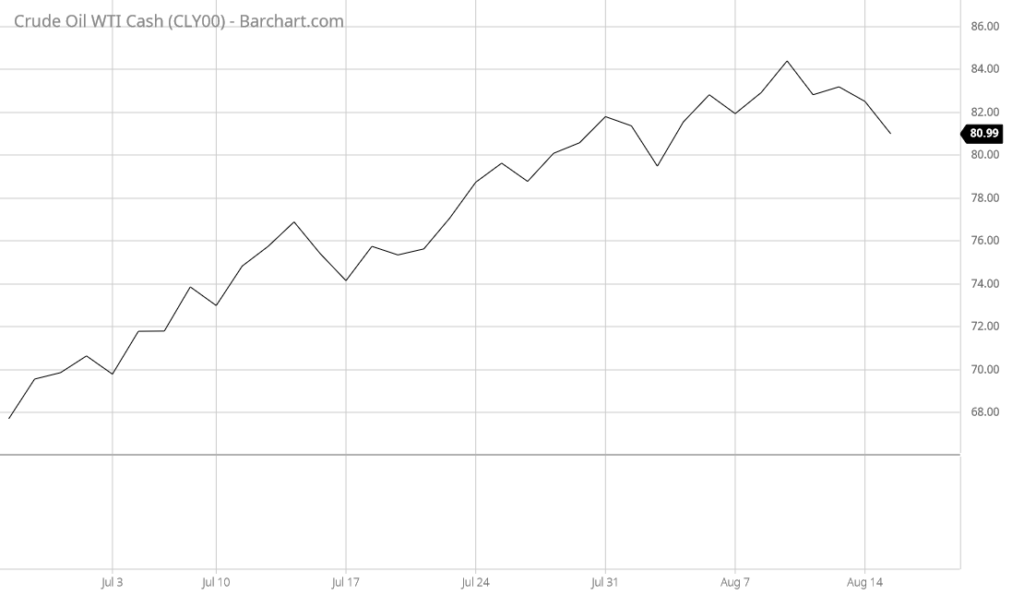
In various previous articles and blog posts, I have suggested that the Federal Reserve will not be as accommodating with interest rates as the market wants. Over the first half of the year, the market was trading as though it was widely anticipating that July would be the final rate hike, and the central bank would begin cutting rates in the second half of the year as well as throughout 2024. The market was overlooking the fact that energy prices account for approximately 7.5% of the consumer price index. This was very important recently, as crude oil prices have been rising since late June:

There are two major reasons for this:
- The OPEC production cuts removed about one million barrels per day from the global oil market. All else being equal, these production cuts would push up prices due to the economic law of supply and demand.
- The Biden Administration was selling crude oil from the Strategic Petroleum Reserve up until the middle of July. This was an attempt to keep the price of crude oil artificially low following the OPEC production cuts. The Strategic Petroleum Reserve no longer has sufficient crude oil to supply the market.
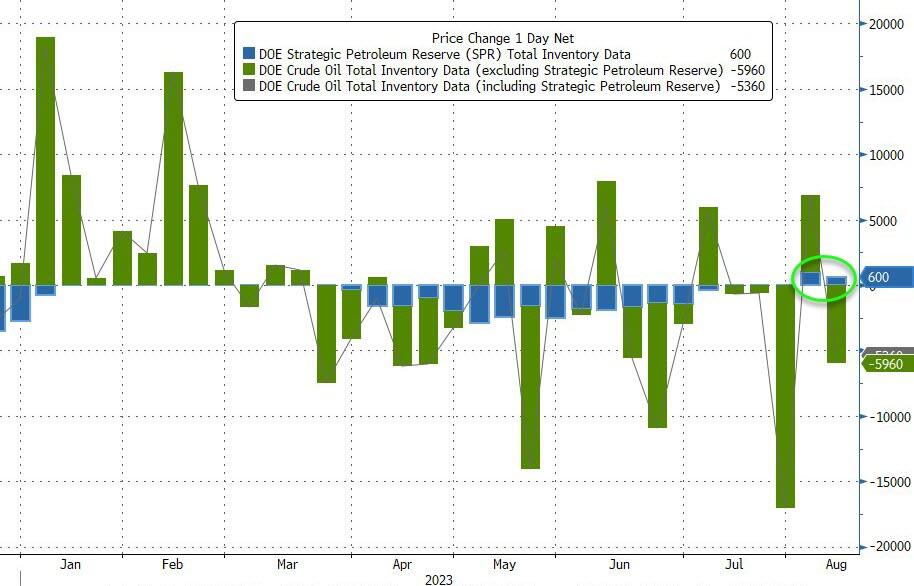
In fact, with respect to this second point, the Biden Administration has begun to refill the Strategic Petroleum Reserve. Over the past week, it purchased 600,000 barrels:

This not only meant that the supply of crude oil was lower, but a large new source of incremental demand has come into the market. This should serve to push crude oil prices up further, once again due to the economic law of supply and demand.
However, this report is not about the crude oil market. It is about the market’s dashed expectations of a near-term rate cut. As crude oil prices went up over the past month and gasoline prices account for a not-insignificant proportion of the consumer price index, the headline inflation rate went up in August:

This indicates that the Federal Reserve’s fight against inflation is nowhere close to over. Indeed, the fact that inflation is getting worse could force the hand of the Federal Reserve. Not only will we not get the rate cut that was expected, but we could actually see interest rates go up further from the previous level.
The market did seem to recognize this. As we can see here, the S&P 500 Index (SPY) dropped precipitously around the beginning of August and has been steadily declining ever since:

However, this has only been a very small drop so far. There are still numerous indicators stating that the market appears to be significantly overvalued even following this decline.
The Bond King’s Take
Recently, “Bond King” Bill Gross pointed this out in an interview with Bloomberg TV last Friday. Here is the full video of the segment:
Mr. Gross made a few very good points in this segment, and I recommend that anyone with assets invested in the market watch it. In particular, he made a few important observations.
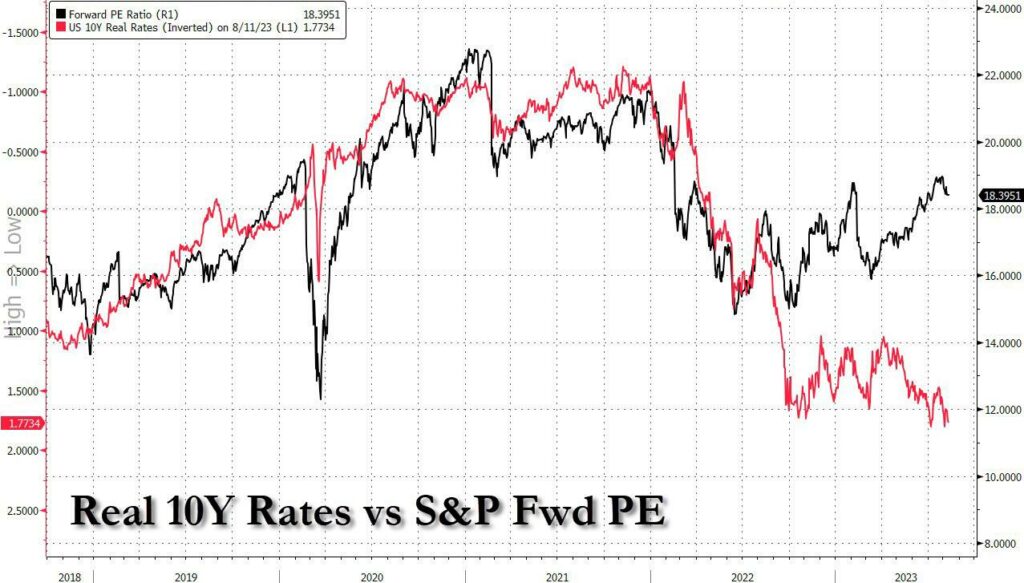
The first observation that he pointed out is that the divergence between real rates and the forward price-to-earnings ratio of the S&P 500 Index has never been higher:

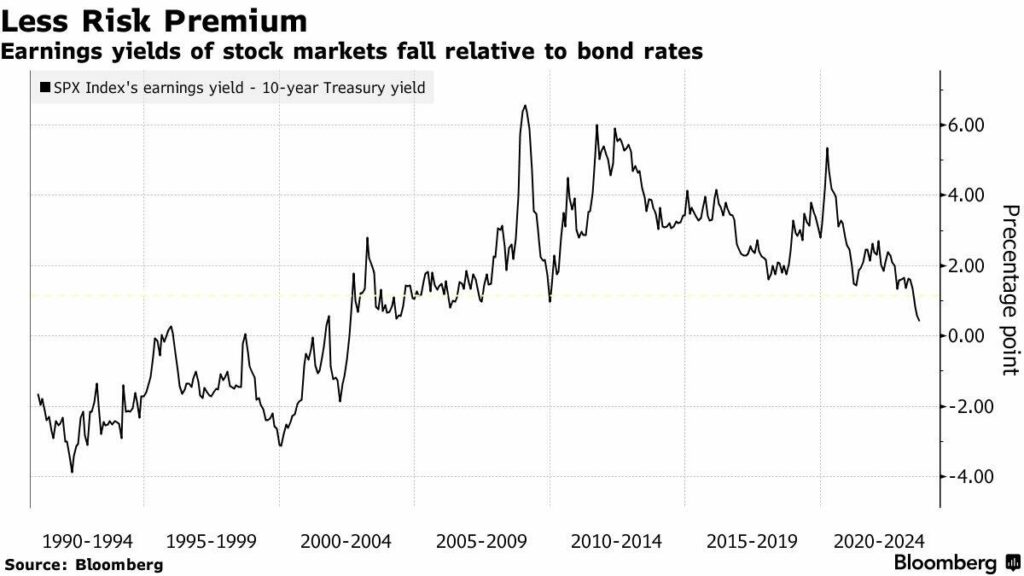
This is a sign that either the S&P 500 Index is substantially overvalued, bonds as a whole are substantially overvalued, or both. Mr. Gross believes that both assets are overvalued. To make his point, he points to the equity risk premium, which is the difference between earnings yields and bond yields. This figure today is at its lowest level in two decades:

What this tells us is that right now there is absolutely no reason for investors to take on the additional risks of stock ownership when compared to bonds. It is important to note that this is with bond prices at their current level. Mr. Gross also believes that bonds are too expensive right now, which means that the equity risk premium could very easily be negative if bonds were fairly priced. Thus, from a risk-reward perspective, stocks need to come down quite a lot before owning them provides sufficient compensation for investors compared to the risk of bond ownership.
For his part, Mr. Gross believes that the ten-year Treasury should be at 4.50% right now. As of the time of writing, the ten-year Treasury is at 4.09%, so it is too expensive right now. In addition, this ten-year Treasury price implies that the Federal Reserve will cut rates more than it probably will in the face of rising headline inflation.
Total Market Cap-to-GDP Ratio
In previous posts on the topic of market valuations, I mentioned a little-followed ratio known as the total market cap-to-GDP ratio. As the name of the ratio implies, it is calculated by taking the total value of all the stocks based in a given nation and comparing them to that nation’s gross domestic product. While this is not a ratio that is often discussed in the financial media, Warren Buffett has described it as “probably the best single measure of where valuations stand at any given moment.” As such, the use of this ratio as a valuation metric does have some strong support from some of the best investing minds of all time.
As of the time of writing, the American Total Market Index, which tracks all publicly-traded American stocks, stands at $45.314 trillion. That is 168.9% of the last reported gross domestic product, and it is well above the historical average of 100%. While this is not its all-time high, it is pretty close:

If we extend the chart back more than twenty years, we see that the Total Market Index was almost always less than gross domestic product.

In fact, prior to 2013, every single time the Total Market Index exceeded gross domestic product, the market crashed. The fact that it has gone ten years without crashing does not mean that it will not crash in the future, just that it has not happened yet. As we can see above, every time that crash came, the market index fell to a level that was less than the gross domestic product. Were that to happen today, it would mean that the market would decline by a minimum of 68.82% from its current level. It is difficult to predict when such an event might occur, nor what the trigger would be, and we could see the market continue to be overvalued for quite a long time even from today.
It would be wise to at least keep this information in your head when deciding how to best position and deploy your assets.
